
Nobody calls their home a position, but that is what it is. The 2026 spread did not create the risk; it printed the invoice.
 ByAbhii Dabas
2026 in four numbers
| Figure | What it measures |
|---|---|
| US$98.3tn | Total HNWI wealth worldwide |
| 22% | Of UHNWIs adding prime residential in 2026 |
| 65.5pts | The 2026 prime spread: Tokyo +58.5% to London -7.0% |
| 70+ | Markets Intric compares on one basis |
Sources: Capgemini 2026, Knight Frank 2026, Knight Frank PIRI, Intric.
The seven, in order
1. Tokyo
The 2026 outlier at around +58.5% on Knight Frank data, substantially a weak-yen value story for dollar-based wealth. The lesson stands even after the surge: currency is half the return.
2. Dubai
Around +25.1% in 2026, zero personal income tax on PwC data, and the deepest global liquidity above US$10m. The portfolio’s tax-and-liquidity engine, on a dollar-pegged currency.
3. London
The correction entry: prime central London fell around 7.0% in the year to Q1 2026, discounting access to sterling, estate-friendly structures, and UK education. Price the 16%-plus non-resident stamp duty honestly first.
4. Singapore
The stability anchor: top-ten safety, top-five climate resilience, and Asia’s strongest rule of law. It rarely leads an index year, which is precisely its job.
5. Lisbon
Eurozone exposure with residency optionality via Portugal’s fund-route golden visa, and Europe’s most established nomad-and-expat demand base underneath prices.
6. Miami
Dollar depth in the largest property economy on earth, and the branded-residence capital of the market’s biggest region.
7. Bangkok
The growth satellite: a named driver of Asia-Pacific’s branded-residence surge and home to new UK school campuses, putting two 2026 demand stories under one entry price.
On INTRIC now — Residences on INTRIC are open to enquiry straight from this page.

The Exchange
APARTMENT · Penn Road, Watford WD24 4AD, United Kingdom
GBP 297.5K – GBP 700K
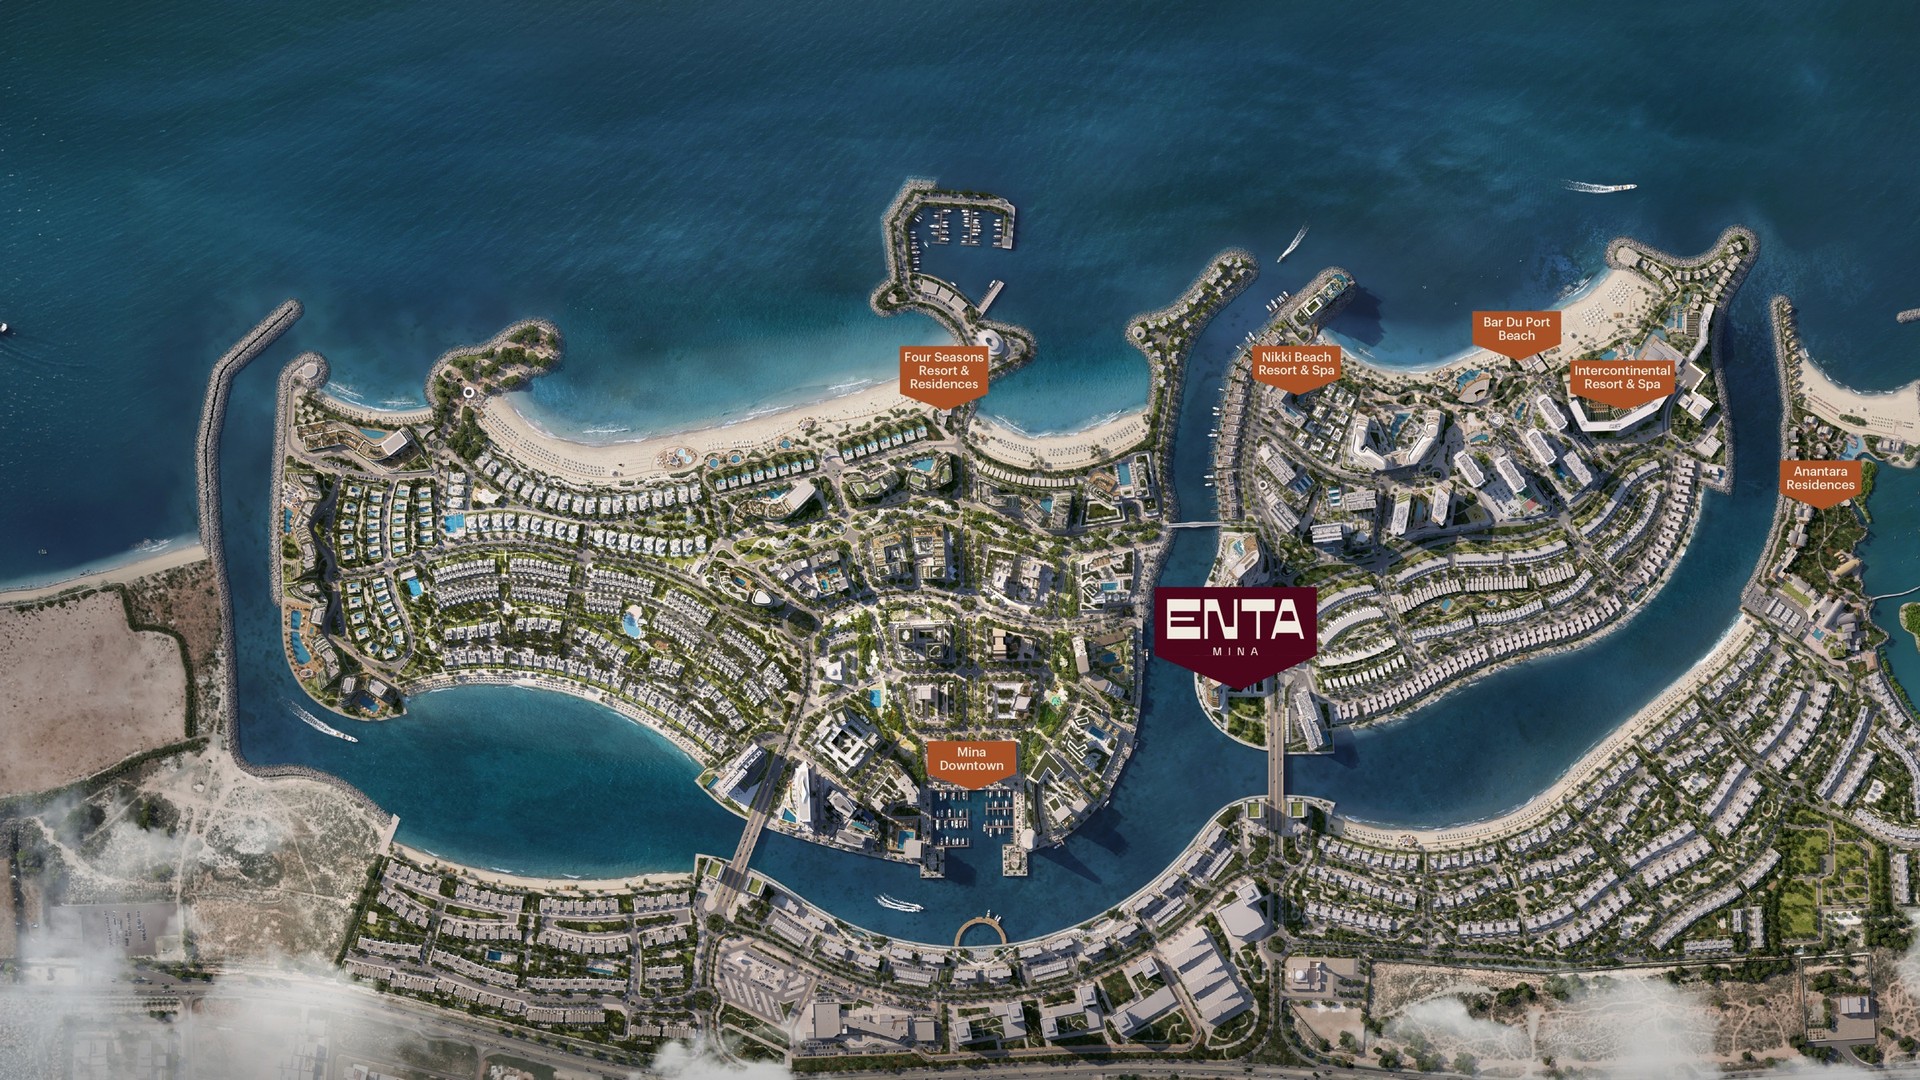
ENTA
APARTMENT · Hayat Island, Mina, Ras Al Khaimah, UAE
AED 960K – AED 2.87M

Riva Residences
APARTMENT · Dubai Maritime City, Dubai, United Arab Emirates
AED 2.53M – AED 5.80M
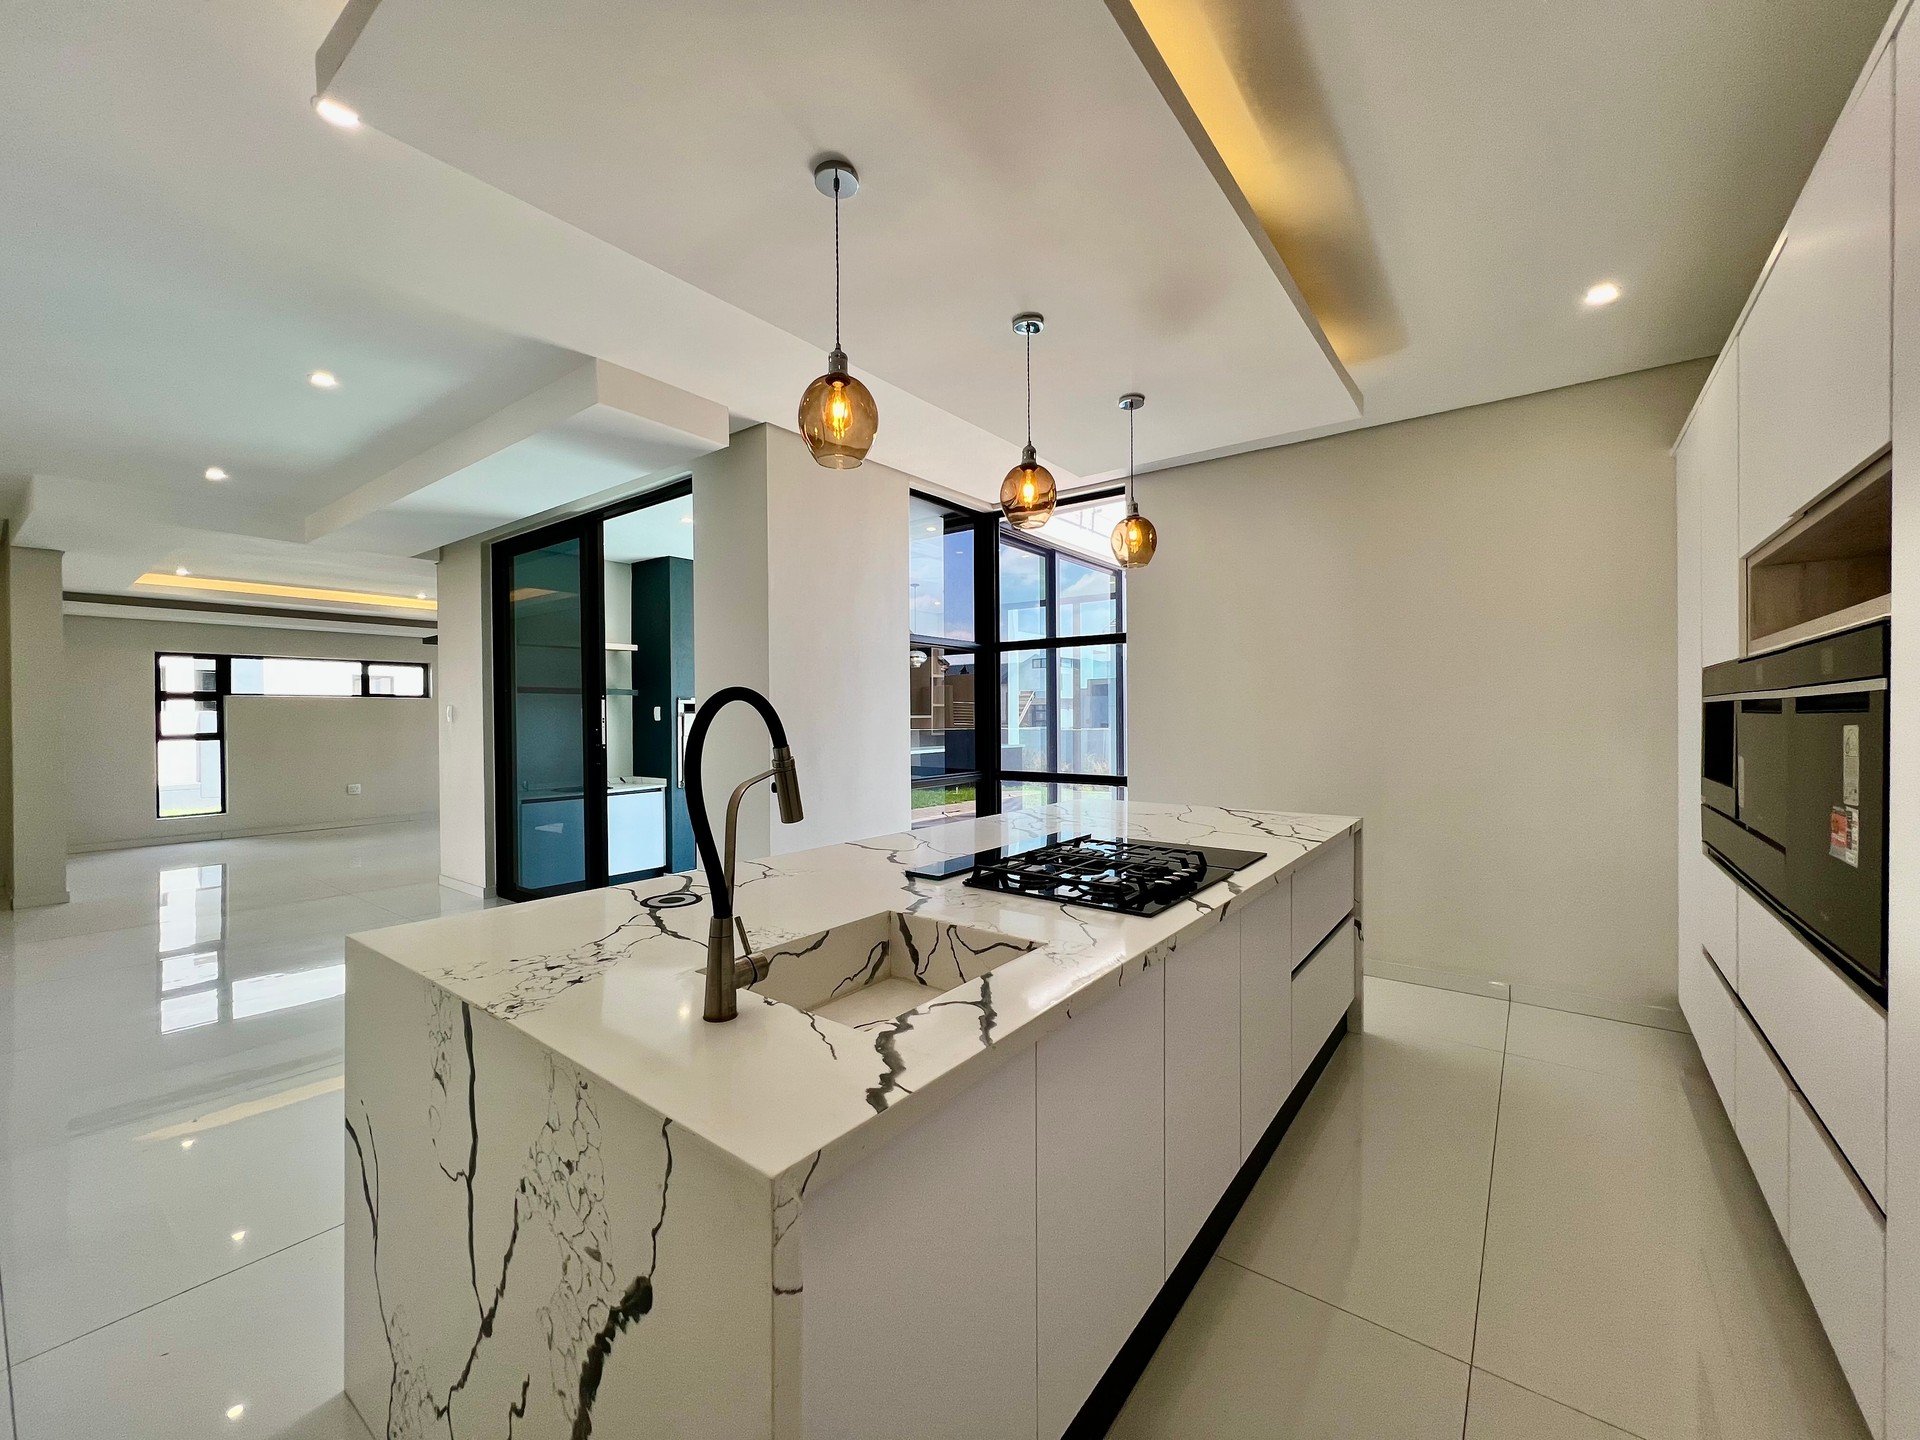
6-Bedroom House in Pretoria
HOUSE · Pretoria, Gauteng, South Africa
From ZAR 9.30M
The 2026 picture side by side
| Base | Currency exposure | What it adds to a portfolio |
|---|---|---|
| Tokyo | Japanese yen | The 2026 outlier at ~+58.5%; a currency-value play for dollar-based wealth |
| Dubai | US dollar-pegged dirham | Zero income tax and the deepest liquidity above US$10m |
| London | Sterling | Correction-priced entry (~-7.0% to Q1 2026) to estate-friendly structures and education |
| Singapore | Singapore dollar | The stability anchor: safety, rule of law, climate resilience |
| Lisbon | Euro | Eurozone exposure with residency optionality via the fund-route golden visa |
| Miami | US dollar | The largest, deepest property economy on earth |
| Bangkok | Thai baht | The value-and-growth satellite riding APAC’s branded and education surge |
Prime movements from Knight Frank PIRI and prime central London data, 2026. Figures rounded. Past performance is not a guide to future performance. Capital at risk.
Diversification is the portfolio view of every intent
How does diversification relate to the other buyer intents? It is the discipline that arranges them. Each intent picks a base; diversification decides how the bases fit together, across currencies, regimes, and cycles. It is the reason a family that could buy twice in one city buys once in two.
On INTRIC now — Still open on INTRIC — every one of these answers enquiries directly.

Nura
APARTMENT · Mina Central Boulevard, Mina, Ras Al Khaimah, UAE
AED 1.30M – AED 3.85M

Whizdom The Forestias: Petopia Tower
CONDOMINIUM · Bang Na-Trat Frontage Road (KM. 7), Bang Kaeo, Bang Phli District, Samut Prakan 10540, Thailand
THB 5.60M – THB 51.20M

Lunara on The Strand
APARTMENT · The Strand, Marjan Beach District, Ras Al Khaimah, UAE
AED 1.05M – AED 4.68M

Apartments in Avsallar, Alanya (AYT-02475)
APARTMENT · Alanya, Antalya, Turkey
EUR 89K – EUR 163K
The three axes
- Currency: hold across at least two blocs; over five years FX can outweigh the whole yield differential.
- Regime: spread across tax jurisdictions so no single government’s reform moves your whole portfolio.
- Intent: give each base a different job; two assets doing the same job in the same regime are one position.
Nobody calls their home a position, but that is what it is. The 2026 spread did not create the risk; it printed the invoice.
Read the full intelligence report
“One market is a bet: property diversification in 2026” goes deeper on the full 2026 spread data, the three-axis framework, and the liquidity pairing logic. Access it through the free Explorer tier at intricglobal.com/en/subscribe.
Frequently asked questions
Why diversify property internationally?
Because 2026 outcomes ranged from Tokyo at around +58.5% to prime central London at around -7.0% within one index year, per Knight Frank. Diversification converts that spread into an average.
Which property markets performed best in 2026?
Tokyo led at around +58.5%, Dubai rose around +25.1%, and the Middle East was the top region at around +9.4%, against a global prime average of around +3.2%.
Does buying two properties in one city diversify?
No. Same currency, regime, and cycle is one position. Diversify across currency blocs, policy jurisdictions, and the job each asset does.
How does currency affect property returns?
Over a five-year hold, currency moves can outweigh the entire yield differential between two markets; Tokyo’s 2026 year was substantially a currency story.
This article is information only and is not tax, legal, immigration, or investment advice. Rules change frequently and vary by circumstance; take qualified professional advice. Property values can fall as well as rise and capital is at risk. Figures are rounded and attributed to Knight Frank, Capgemini, PwC, and Henley & Partners.
Abhii Dabas is the Founder and CEO of INTRIC Global, the cross-border property intelligence platform for serious investors. He advises high-net-worth buyers on international real estate strategy and has evaluated residential markets across more than 40 countries.